by Bruce Niederer — GBI Technical Advisor
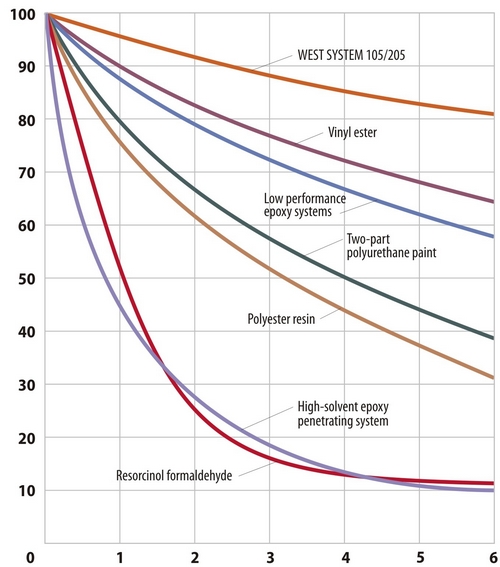
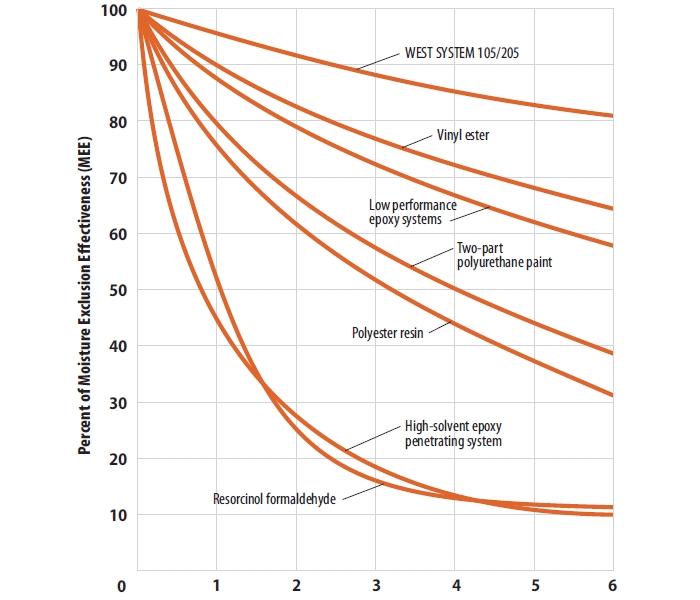
Above: A graph of moisture exclusion effectiveness.
I get mad at my computer fairly often these days when it takes more than a few seconds to open a file from an obscure site on the other side of the planet. Who has that kind of time to waste? Don’t even ask about photo files. There’s no point in arguing about it—we live in an accelerated world. We hate waiting for anything. Putting the social implications of this aside, a business involved in technical applications and products cannot afford to wait for real-time field test results. We need data and we need it yesterday!
The focus of this article on accelerated testing will be how we test the ability of a coating applied in a relatively thin film to resist water transmission. This test is called Moisture Exclusion Effectiveness (MEE). It is based on a method developed by the USDA Forest Products Laboratory. Since we use two of our three environmental huts for this test, I’ll describe the huts first.
Our Environmental Huts
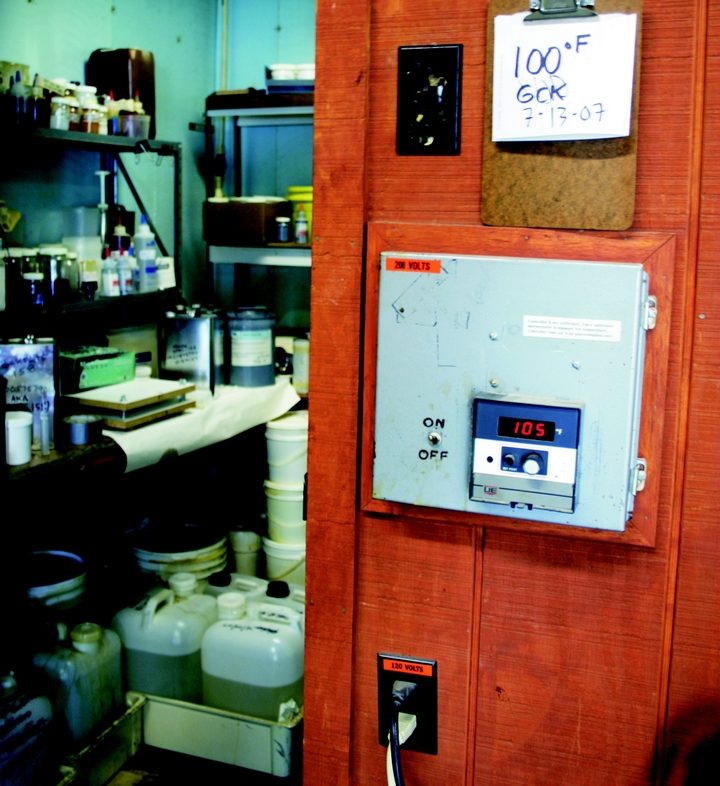
One hut is called the hot/dry hut or, more affectionately, the Arizona room. Although the temperature may be changed occasionally, the Arizona room is kept at 100°F with relative humidity (RH) close to 0%, so it’s perfect for drying wood samples. The next hut is called the hot/wet hut or the Florida room. It is kept at 100°F and 100% RH. The heat is supplied by heating a 55-gallon drum of water. The remaining hut is called the cool/humid hut or the Seattle room. The temperature and RH are variable but generally kept between 50°F–65°F and 70–80% RH. Test samples of nearly any material can be tested in each of these huts on an accelerated time schedule.

The Moisture Exclusion Effectiveness Test
The Moisture Exclusion Effectiveness (MEE) test begins with Douglas fir plywood blanks 3″×5″×5 8″ with the corners and edges sanded round. A small cup hook is installed on each end. The sample blanks are then conditioned in the Arizona room for about 2 weeks or until the moisture content of the blanks levels out close to 0%. This is easily done by tracking the weight lost over time in the room. Then the blanks are removed from the hut, allowed to assume room temperature, and weighed very accurately to 4 decimal places. This is recorded as the dry weight.
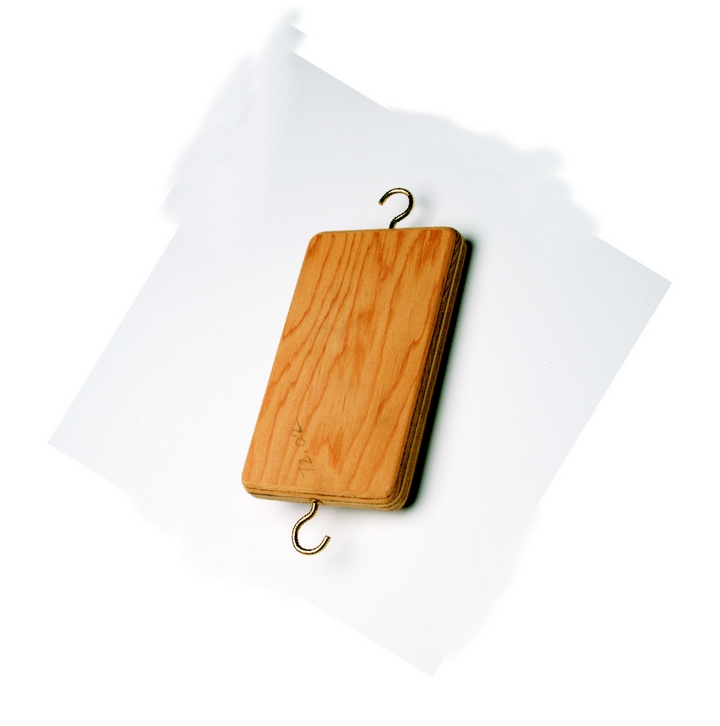
Next, the blanks are coated with whatever product is being tested—we always test our products, as well as competitors’ products, Moisture Exclusion Effectiveness Accelerated testing in our environmental huts whether they’re epoxy or another product (paints, polyesters, vinyl esters, etc.). Generally, we make 5 samples each with 1, 2, and 3 coats for a total of 15 pieces for each test material. Five samples generate an acceptable average, and the increasingly thicker coating allows for a curve to be generated for each test material. The resulting data (Figure 1) yield a more accurate characterization of how effective any given material is at resisting moisture transmission.
After the coatings are properly cured, the weight is again recorded. Then, the samples are hung in a rack and placed in the Florida room. The weight gain is measured each week for approximately 6 weeks or until the curves shown in Figure 1 begin to flatten out. As with any good test procedure, control samples left un-coated are run alongside the test samples.
| Specimen | % Weight gain above initial weight after coating | ||||
| 105/205 | @1 day | @1 week | @2 weeks | @3 weeks | @8 weeks |
| LC (uncoated) | 8.59 | 14.41 | 19.44 | 19.96 | 23.41 |
| L2 (2 coats) | 0.77 | 3.68 | 7.02 | 9.52 | 18.11 |
| L3 (3 coats) | 0.31 | 1.34 | 2.57 | 3.61 | 8.02 |
| HC (uncoated) | 7.30 | 14.69 | 19.38 | 19.88 | 21.66 |
| H1 (1 coat) | 3.73 | 12.31 | 17.37 | 18.95 | 21.95 |
| H2 (2 coats) | 0.41 | 2.04 | 4.00 | 5.56 | 11.59 |
| HC (3 coats) | 0.28 | 0.96 | 1.9 | 2.6 | 5.85 |
| 105/205/422 | |||||
| LC (uncoated) | 7.92 | 14.78 | 19.15 | 19.33 | 20.22 |
| L1 (1 coat) | 1.77 | 9.39 | 15.34 | 17.43 | 20.79 |
| L2 (2 coats) | 0.27 | 1.20 | 2.29 | 3.39 | 7.55 |
| L3 (3 coats) | 0.25 | 0.92 | 1.56 | 2.36 | 5.17 |
| HC (uncoated) | 7.15 | 13.61 | 18.65 | 24.85 | 26.47 |
| H1 (1 coat) | 1.24 | 8.14 | 15.28 | 21.05 | 28.97 |
| H2 (2 coats) | .029 | 1.43 | 2.77 | 4.81 | 11.98 |
This is an accelerated test because the Florida room conditions create water vapor, and water vapor is much more energetic than liquid water. This energized water vapor will penetrate a semi-permeable membrane much faster than liquid water will.
Because all coatings are semi-permeable membranes, we can generate curves that compare the relative permeability of various coatings. As shown in Figure 2, WEST SYSTEM® 105/205 performs quite well relative to the other materials tested (the product names were omitted to protect the innocent.)
If you are interested in further reading, see the Forest Product Laboratory Research Paper FPL-482 “The Moisture Excluding Effectiveness of Finishes on Wood Surfaces,” available from the National Technical Information Service, 5285 Port Royal Road, Springfield, VA 22161. This details a study which investigated multiple variables for a broad range of wood finishes. Of note is the observation that two-component sheathing epoxy adhesive was second only to complete encapsulation in paraffin wax as a moisture excluding barrier.
For a more detailed description of the Moisture Exclusion Effectiveness test procedure, download the PDF Moisture Exclusion Effectiveness.

